

An index evaluating cities most resilient in preserving wealth through the last decade of global disruption.
Introduction
The Wealth Preservation Cities Index retrospectively ranks the top 25 global cities that best preserved individual wealth over the decade from 2015 to 2025. It evaluates economic and financial resilience using a two-stage process: national-level filtering and city-level scoring. The goal is to provide a robust and comparative framework for evaluating how well cities have maintained wealth in real terms, accounting for inflation, asset values, earnings, and governance environments.
Key Findings
#1—Zug: Tops the list thanks to its exceptional quality of life, stable governance, and Switzerland’s long-standing reputation as a haven for wealth.
#2—Hong Kong: Ranks second, combining strong national fundamentals with resilient property values and a notable 21% improvement in quality of life over the decade.
#3—Basel: Secures third place by offering a well-balanced mix of asset security, quality living standards, and Switzerland’s robust wealth protection framework.
Methodology
The index was constructed through a two-stage process combining national macroeconomic screening with city-level performance scoring.
Stage 1: Country-Level Screening
A total of 196 countries were assessed using five equally weighted indicators:
- GDP per capita
- Exchange rate volatility
- Inflation rate
- Effective tax rate
- Governance quality
Following an inflation-adjusted review over the ten-year period, each indicator was normalised using min-max scaling, and only countries with a composite score of 0.80 or above were selected. This threshold ensured the inclusion of only macro-economically stable jurisdictions.
Stage 2: City-Level Scoring
Cities within the selected countries, primarily major urban hubs by GDP, were evaluated based on three wealth-relevant indicators:
- Property values: 2025 price per m² and inflation-adjusted growth since 2015
- Average salaries: 2025 salary levels and real growth since 2015
- Quality of Life: Proxy for long-term liveability and stability
Inflation-adjusted 2015 data were compared to 2025 figures and normalised for comparability. A weighted scoring system placed greater emphasis (35%) on absolute 2025 values of salaries and property, with 10% weights on changes and quality-of-life shifts.
Final Index Construction
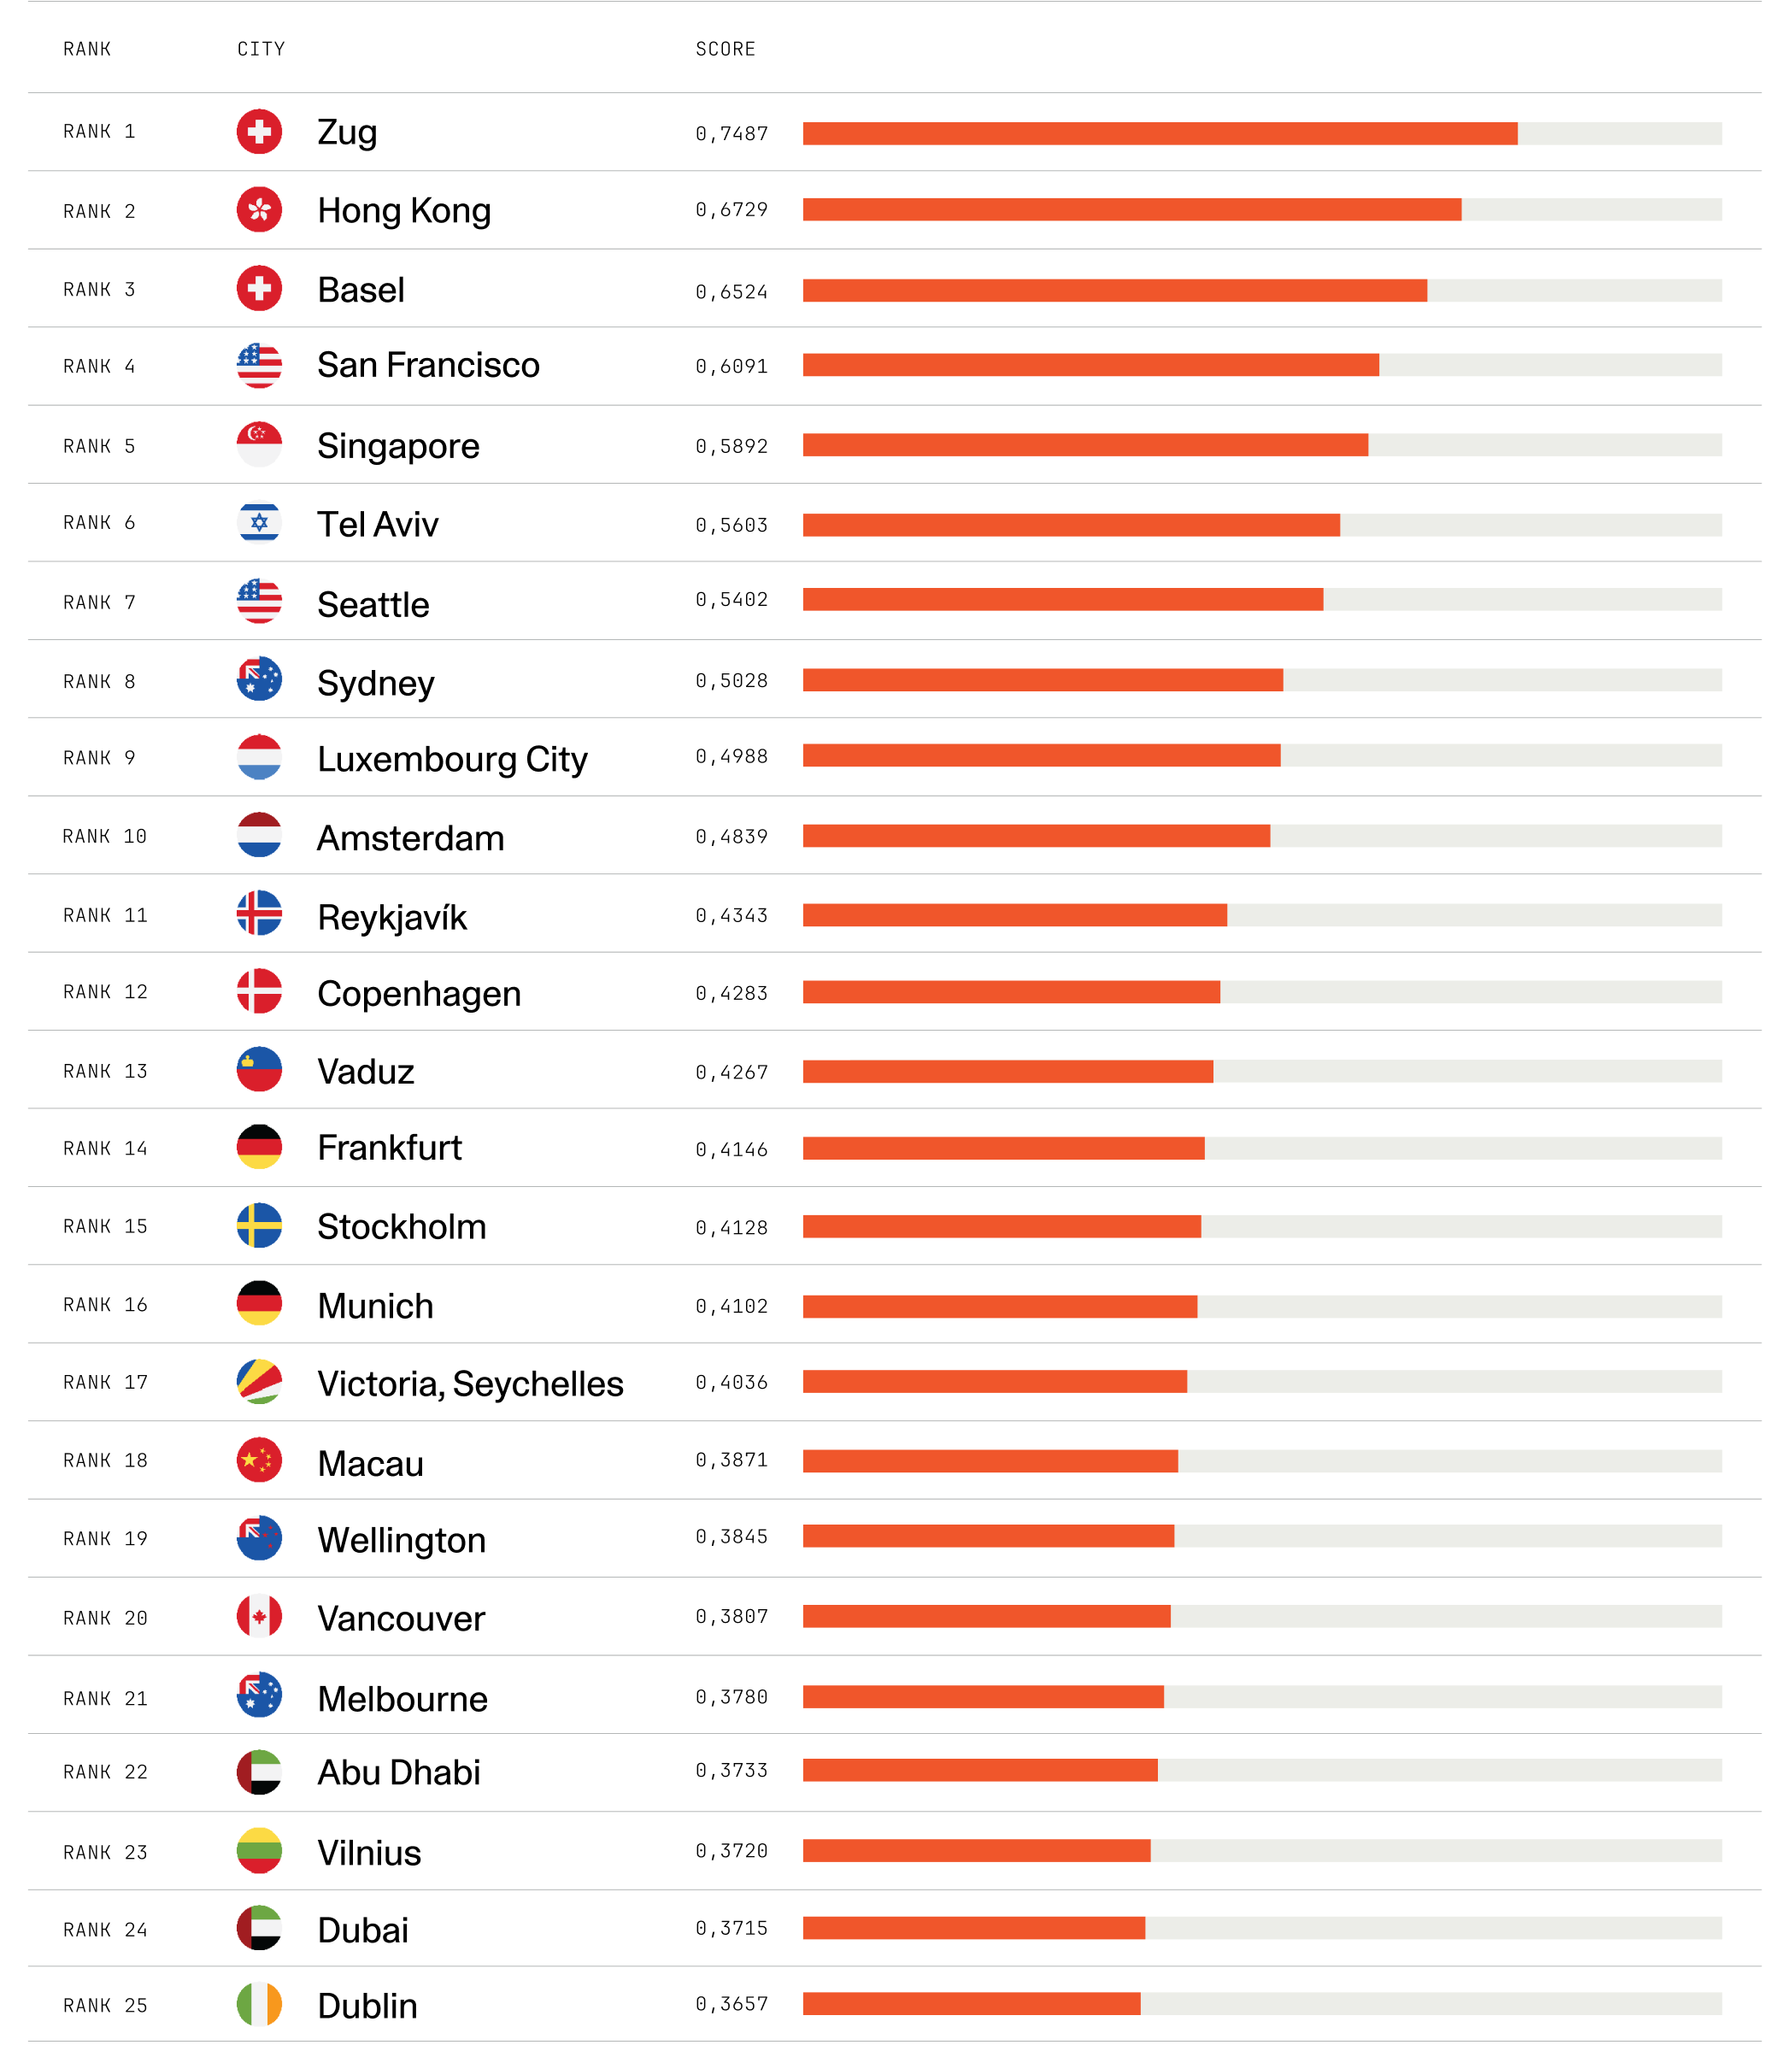
Cities were ranked by their composite scores, with the top 25 forming the final Wealth Preservation Index. Higher scores indicate stronger long-term performance in preserving wealth in real terms.
Observations
- Yerevan, Vilnius, Bratislava, and Reykjavik saw the highest inflation-adjusted property price gains, though values remain well below those in wealthier cities.
- Hong Kong, Zug, and Vilnius posted strong Quality of Life gains, while Kuwait City and Sofia saw sharp declines of 17% and 12%, respectively.
- Japan and China fell below the 0.80 threshold due to high taxes and economic volatility, despite hosting wealthy global cities, individual wealth preservation remains limited.
An index evaluating cities most resilient in preserving wealth through the last decade of global disruption.
Introduction
The Wealth Preservation Cities Index retrospectively ranks the top 25 global cities that best preserved individual wealth over the decade from 2015 to 2025. It evaluates economic and financial resilience using a two-stage process: national-level filtering and city-level scoring. The goal is to provide a robust and comparative framework for evaluating how well cities have maintained wealth in real terms, accounting for inflation, asset values, earnings, and governance environments.
Key Findings
#1—Zug: Tops the list thanks to its exceptional quality of life, stable governance, and Switzerland’s long-standing reputation as a haven for wealth.
#2—Hong Kong: Ranks second, combining strong national fundamentals with resilient property values and a notable 21% improvement in quality of life over the decade.
#3—Basel: Secures third place by offering a well-balanced mix of asset security, quality living standards, and Switzerland’s robust wealth protection framework.
Methodology
The index was constructed through a two-stage process combining national macroeconomic screening with city-level performance scoring.
Stage 1: Country-Level Screening
A total of 196 countries were assessed using five equally weighted indicators:
- GDP per capita
- Exchange rate volatility
- Inflation rate
- Effective tax rate
- Governance quality
Following an inflation-adjusted review over the ten-year period, each indicator was normalised using min-max scaling, and only countries with a composite score of 0.80 or above were selected. This threshold ensured the inclusion of only macro-economically stable jurisdictions.
Stage 2: City-Level Scoring
Cities within the selected countries, primarily major urban hubs by GDP, were evaluated based on three wealth-relevant indicators:
- Property values: 2025 price per m² and inflation-adjusted growth since 2015
- Average salaries: 2025 salary levels and real growth since 2015
- Quality of Life: Proxy for long-term liveability and stability
Inflation-adjusted 2015 data were compared to 2025 figures and normalised for comparability. A weighted scoring system placed greater emphasis (35%) on absolute 2025 values of salaries and property, with 10% weights on changes and quality-of-life shifts.
Final Index Construction
Cities were ranked by their composite scores, with the top 25 forming the final Wealth Preservation Index. Higher scores indicate stronger long-term performance in preserving wealth in real terms.
Observations
- Yerevan, Vilnius, Bratislava, and Reykjavik saw the highest inflation-adjusted property price gains, though values remain well below those in wealthier cities.
- Hong Kong, Zug, and Vilnius posted strong Quality of Life gains, while Kuwait City and Sofia saw sharp declines of 17% and 12%, respectively.
- Japan and China fell below the 0.80 threshold due to high taxes and economic volatility, despite hosting wealthy global cities, individual wealth preservation remains limited.

Contributors

.png)


.png)
.png)

Articles