


An index evaluating cities with the most conducive tax environment globally backed by stable governance.
Introduction
The Tax Friendly Cities Index 2025 identifies cities that foster favourable tax environments through a multi-metric analysis. The index includes major metropolitan areas within the top 20 tax-friendly countries, ranked based on national-level assessments across 164 jurisdictions. These jurisdictions were selected based on data availability [1], with high-risk locations excluded due to political or security concerns.
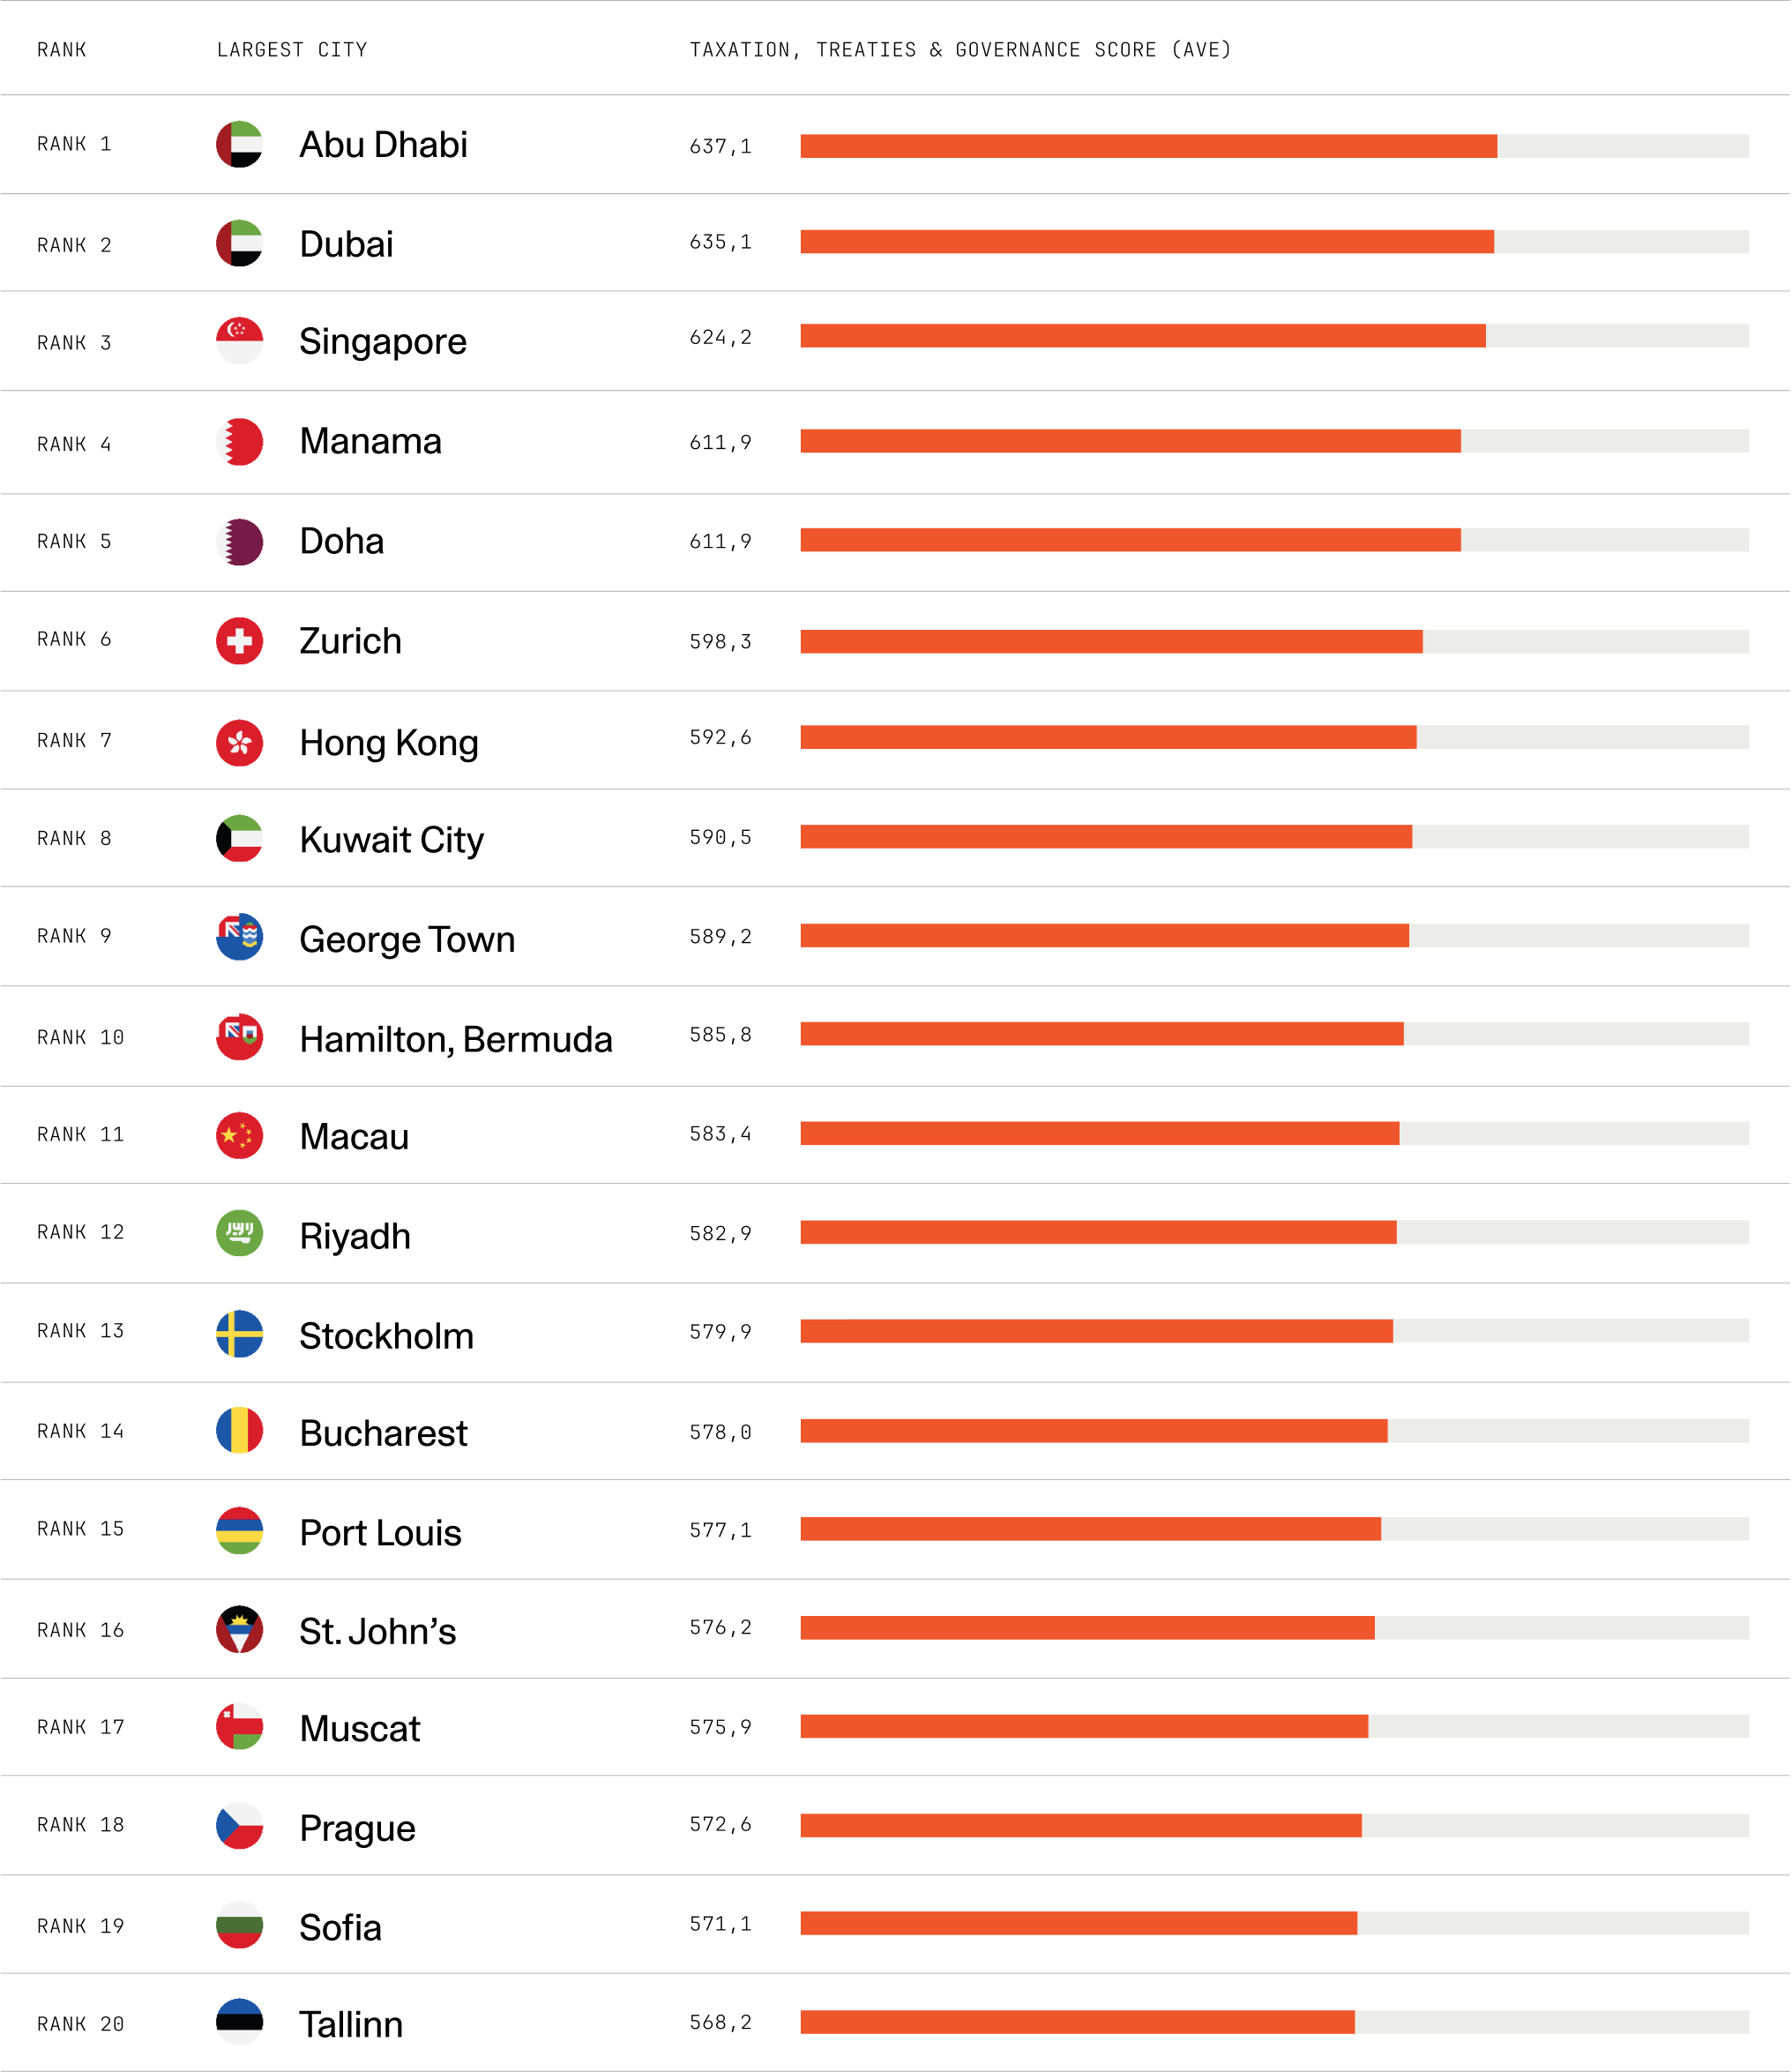
Tax Friendly Cities Index 2025
Key findings
#1—Abu Dhabi: Ranks first, combining tax efficiency with robust legal structures. Abu Dhabi’s property-related fees, such as transfer fee and municipality fee, which can be deemed as de facto property tax, are lower than Dubai’s.
#2—Dubai: Comes in second for offering an unbeatable mix of low taxes, strong governance, and global accessibility through its extensive treaty network.
#3—Singapore: Comes in third. It may not have a low headline tax like the UAE, but it exhibits fiscal intelligence with world-class governance that is hard to match.
Methodology
This index evaluates tax friendliness across 164 countries using a composite of three core metrics:
- Tax Rate Environment
- International Tax Accessibility
- Governance Quality
Metric 1: Tax Rate Environment
This metric captures the maximum potential tax exposure in each jurisdiction by analysing the top statutory rates in five tax categories most relevant to HNWIs:
- Personal Income Tax
- Corporate Income Tax
- Inheritance Tax
- Wealth Tax
- Capital Gains Tax
The highest applicable rate in each category was used to reflect potential tax exposure. These were expressed as percentages and summed to create a Total Tax Rate Score (out of 500), with lower totals indicating higher tax burdens.
To align with the index logic (where higher scores reflect greater tax friendliness), the score was inverted using the formula: χ = 500 – γ, where γ is the total tax rate. This transformed the score into a positive indicator of tax attractiveness, ranging from 0 (unfriendly) to 500 (very friendly).
Metric 2: International Tax Accessibility
This metric measures how well a country integrates into the global tax system, using the number of Double Taxation Avoidance Treaties (DTATs) it has ratified. These treaties minimise the risk of double taxation on income across borders and improve legal certainty for investors [2].
A higher number of treaties signals better international tax accessibility and planning potential.
The Tax Rate Score (χ) from Metric 1 was then combined with the DTAT tally to produce a broader Tax Environment Score, capturing both domestic tax efficiency and global tax coordination.
Metric 3: Governance Quality
Strong governance is essential for fair and predictable tax systems. This metric draws on the World Bank Governance Indicators, specifically, Regulatory Quality, reflecting government ability to implement sound policies, was chosen for its relevance to effective tax system design [3].
Since WGI scores range from –2.5 to +2.5, they were rescaled to a 0–250 scale for compatibility with the tax metrics. The transformation followed two simple steps:
- Shift the range to start from zero by adding 2.5 to each score:
(Original score + 2.5)
- Convert to a 0–250 scale by multiplying the result by 50:
(Adjusted score) × 50
This ensured comparability with the tax metrics while emphasizing governance factors that shape long-term institutional reliability.
Final Index and City Selection
A composite score was calculated for each country by combining:
- Tax Environment Score (Metric 1 + Metric 2)
- Tax and Governance Score (Metric 1 + Metric 2 + Metric 3)
The top 20 scoring countries were selected, and their largest financial or administrative cities were evaluated accordingly to represent the jurisdiction.
Observations
- When factoring in double taxation avoidance as an indicator of tax system accessibility, Abu Dhabi, Dubai, Doha, and Kuwait City emerge as top performers, benefiting from the highest number of treaties and climbing at least five places in the rankings.
- Based on tax rates alone, The Valley (Anguilla), St. John's (Antigua and Barbuda), Manama (Bahrain), Hamilton (Bermuda), George Town (Cayman Islands), and Port Vila (Vanuatu) rank as the most tax-friendly jurisdictions, with Dubai and Abu Dhabi (United Arab Emirates) following in second place.
- Dubai, Doha, and Abu Dhabi perform strongly across all three metrics, with Abu Dhabi and Dubai retaining the top position when combining tax environment and governance considerations.
- Singapore jumps from 16th to 6th place when considering the broader tax environment and claims the third spot when governance is factored in. Zurich follows a similar trajectory, rising from 33rd to 8th to 6th, driving home the importance of regulatory quality in the design and implementation of effective tax systems.
- George Town (Cayman Islands) drops from a shared top ranking in tax rates to 9th place when governance is included.
Reflections on Tax Friendly Cities Index from Gabrielle Reid - Head of Insights, Multipolitan

In a world where wealth mobility has become increasingly fluid, taxation remains one of the most powerful levers influencing where high-net-worth individuals (HNWIs) and ultra-high-net-worth individuals (UHNWIs) choose to live, invest, and preserve their wealth. Recognising this complex and rapidly evolving landscape, Multipolitan has developed the Tax Friendly Cities Index 2025, a data-driven tool that identifies global metropolitan centres fostering favourable tax environments. This index serves as a valuable resource for families, advisors, and institutions navigating the complexities of wealth preservation.
Why a Tax Friendly Cities Index matters
Global tax regimes are subject to change. From proposed remittance taxes in the United States to emerging cross-border taxation policies in India and beyond, the global tax conversation is growing more nuanced. At the same time, the number of millionaires relocating internationally continues to rise, with wealth mobility becoming increasingly varied. For wealth holders, tax considerations can directly influence decisions on residency, asset allocation, and long-term wealth structuring.
Wealth taxes, inheritance levies, and capital gains taxes vary widely between jurisdictions, creating a complex matrix of opportunities and risks. While net wealth taxation remains relatively rare across OECD countries, for example, inheritance and gift taxes are more prevalent, albeit contributing modestly to overall tax revenues. Nonetheless, the mobility responses triggered by wealth taxation can significantly impact broader income tax bases, with some studies indicating that losses in personal income tax revenues can far outweigh the direct losses from wealth tax impositions.
In this environment, developing a sophisticated, holistic view of global tax regimes that balances statutory tax rates with governance quality, tax treaty protections, and political stability proves invaluable. Multipolitan's Tax Friendly Cities Index provides precisely this.
A Multi-metric Approach to Tax Friendliness
At the core of the Tax Friendly Cities Index lies a rigorous, multi-layered methodology that evaluates tax environments at both national and metropolitan levels. The index encompasses major cities within the top 20 tax-friendly countries, which were selected from an initial pool of 164 jurisdictions. High-risk locations, such as those experiencing political instability or ongoing conflict, were excluded to maintain the relevance and applicability of the index for wealth preservation purposes.
The assessment is anchored on three primary metrics. The first metric scrutinises statutory tax rates across five key categories directly affecting HNWIs, namely Personal Income Tax; Corporate Income Tax; Inheritance Tax; Wealth Tax and, of increasing relevance, Capital Gains Tax. By focusing on the highest applicable rates within each category, Multipolitan captures the maximum potential tax exposure an individual might face. The second metric recognises that statutory rates alone do not tell the full story. The presence of Double Taxation Avoidance Treaties (DTATs) significantly enhances a jurisdiction's attractiveness by providing legal mechanisms that prevent double taxation on cross-border income. By tallying the number of DTATs each country has ratified, Multipolitan incorporates a practical measure of international tax protection and planning flexibility.
However, a favourable tax regime without effective governance can present unexpected risks to wealth preservation. Accounting for good governance ensures that the index reflects not just the legal tax burden but also the predictability, fairness, and stability of tax enforcement, which remains a crucial consideration for long-term wealth preservation planning.
Not All Cities Are Equal
By anchoring the analysis at the city level, the index captures the practical realities faced by globally mobile families. Metropolitan centres often serve as the real touchpoints for residency, business operations, and lifestyle decisions. This city-specific focus differentiates Multipolitan's index from many country-only tax comparisons, offering actionable insights for families evaluating relocation or expansion opportunities.
A Timely Tool for a Shifting Landscape
The Tax Friendly Cities Index arrives at a moment when tax policy, regulatory enforcement, and global wealth mobility are converging into a more tightly controlled ecosystem. For wealth preservation, this environment demands a sophisticated understanding of multiple overlapping risks. Residency definitions, treaty benefits, regulatory compliance, and reputational considerations all interlace to shape the actual outcomes of wealth preservation strategies. Optionality in lifestyle, citizenship, education, and asset location has become the cornerstone of modern wealth planning. The Multipolitan index supports this need by offering a comprehensive, comparable view of jurisdictions that balance tax competitiveness with governance integrity.
The Tax Friendly Cities Index serves as both a technical resource and a strategic conversation starter. It empowers stakeholders to make informed, forward-looking decisions amidst an increasingly complex global tax landscape. By integrating quantitative rigor with practical relevance, Multipolitan reaffirms its commitment to delivering actionable insights that help clients preserve and grow their wealth across generations.
Sources
[1] Data was sourced from PricewaterhouseCoopers’ Worldwide Tax Summaries, as well as each individual country’s revenue authority.
[2] ICTD (2021). Tax Treaties Explorer [Online database], Brighton: International Centre for Tax and Development (ICTD), retrieved from https://www.treaties.tax. Please note that determining the exact number of double tax treaties (DTTs) for each country can be challenging due to the dynamic nature of international agreements. The numbers provided in the study are deemed to be a sufficient estimate for a comparative analysis such as this one.
[3] Worldwide Governance Indicators, 2024 Update, World Bank (www.govindicators.org), Accessed on 10/30/2024.
An index evaluating cities with the most conducive tax environment globally backed by stable governance.
Introduction
The Tax Friendly Cities Index 2025 identifies cities that foster favourable tax environments through a multi-metric analysis. The index includes major metropolitan areas within the top 20 tax-friendly countries, ranked based on national-level assessments across 164 jurisdictions. These jurisdictions were selected based on data availability [1], with high-risk locations excluded due to political or security concerns.
Tax Friendly Cities Index 2025
Key findings
#1—Abu Dhabi: Ranks first, combining tax efficiency with robust legal structures. Abu Dhabi’s property-related fees, such as transfer fee and municipality fee, which can be deemed as de facto property tax, are lower than Dubai’s.
#2—Dubai: Comes in second for offering an unbeatable mix of low taxes, strong governance, and global accessibility through its extensive treaty network.
#3—Singapore: Comes in third. It may not have a low headline tax like the UAE, but it exhibits fiscal intelligence with world-class governance that is hard to match.
Methodology
This index evaluates tax friendliness across 164 countries using a composite of three core metrics:
- Tax Rate Environment
- International Tax Accessibility
- Governance Quality
Metric 1: Tax Rate Environment
This metric captures the maximum potential tax exposure in each jurisdiction by analysing the top statutory rates in five tax categories most relevant to HNWIs:
- Personal Income Tax
- Corporate Income Tax
- Inheritance Tax
- Wealth Tax
- Capital Gains Tax
The highest applicable rate in each category was used to reflect potential tax exposure. These were expressed as percentages and summed to create a Total Tax Rate Score (out of 500), with lower totals indicating higher tax burdens.
To align with the index logic (where higher scores reflect greater tax friendliness), the score was inverted using the formula: χ = 500 – γ, where γ is the total tax rate. This transformed the score into a positive indicator of tax attractiveness, ranging from 0 (unfriendly) to 500 (very friendly).
Metric 2: International Tax Accessibility
This metric measures how well a country integrates into the global tax system, using the number of Double Taxation Avoidance Treaties (DTATs) it has ratified. These treaties minimise the risk of double taxation on income across borders and improve legal certainty for investors [2].
A higher number of treaties signals better international tax accessibility and planning potential.
The Tax Rate Score (χ) from Metric 1 was then combined with the DTAT tally to produce a broader Tax Environment Score, capturing both domestic tax efficiency and global tax coordination.
Metric 3: Governance Quality
Strong governance is essential for fair and predictable tax systems. This metric draws on the World Bank Governance Indicators, specifically, Regulatory Quality, reflecting government ability to implement sound policies, was chosen for its relevance to effective tax system design [3].
Since WGI scores range from –2.5 to +2.5, they were rescaled to a 0–250 scale for compatibility with the tax metrics. The transformation followed two simple steps:
- Shift the range to start from zero by adding 2.5 to each score:
(Original score + 2.5)
- Convert to a 0–250 scale by multiplying the result by 50:
(Adjusted score) × 50
This ensured comparability with the tax metrics while emphasizing governance factors that shape long-term institutional reliability.
Final Index and City Selection
A composite score was calculated for each country by combining:
- Tax Environment Score (Metric 1 + Metric 2)
- Tax and Governance Score (Metric 1 + Metric 2 + Metric 3)
The top 20 scoring countries were selected, and their largest financial or administrative cities were evaluated accordingly to represent the jurisdiction.
Observations
- When factoring in double taxation avoidance as an indicator of tax system accessibility, Abu Dhabi, Dubai, Doha, and Kuwait City emerge as top performers, benefiting from the highest number of treaties and climbing at least five places in the rankings.
- Based on tax rates alone, The Valley (Anguilla), St. John's (Antigua and Barbuda), Manama (Bahrain), Hamilton (Bermuda), George Town (Cayman Islands), and Port Vila (Vanuatu) rank as the most tax-friendly jurisdictions, with Dubai and Abu Dhabi (United Arab Emirates) following in second place.
- Dubai, Doha, and Abu Dhabi perform strongly across all three metrics, with Abu Dhabi and Dubai retaining the top position when combining tax environment and governance considerations.
- Singapore jumps from 16th to 6th place when considering the broader tax environment and claims the third spot when governance is factored in. Zurich follows a similar trajectory, rising from 33rd to 8th to 6th, driving home the importance of regulatory quality in the design and implementation of effective tax systems.
- George Town (Cayman Islands) drops from a shared top ranking in tax rates to 9th place when governance is included.
Reflections on Tax Friendly Cities Index from Gabrielle Reid - Head of Insights, Multipolitan
In a world where wealth mobility has become increasingly fluid, taxation remains one of the most powerful levers influencing where high-net-worth individuals (HNWIs) and ultra-high-net-worth individuals (UHNWIs) choose to live, invest, and preserve their wealth. Recognising this complex and rapidly evolving landscape, Multipolitan has developed the Tax Friendly Cities Index 2025, a data-driven tool that identifies global metropolitan centres fostering favourable tax environments. This index serves as a valuable resource for families, advisors, and institutions navigating the complexities of wealth preservation.
Why a Tax Friendly Cities Index matters
Global tax regimes are subject to change. From proposed remittance taxes in the United States to emerging cross-border taxation policies in India and beyond, the global tax conversation is growing more nuanced. At the same time, the number of millionaires relocating internationally continues to rise, with wealth mobility becoming increasingly varied. For wealth holders, tax considerations can directly influence decisions on residency, asset allocation, and long-term wealth structuring.
Wealth taxes, inheritance levies, and capital gains taxes vary widely between jurisdictions, creating a complex matrix of opportunities and risks. While net wealth taxation remains relatively rare across OECD countries, for example, inheritance and gift taxes are more prevalent, albeit contributing modestly to overall tax revenues. Nonetheless, the mobility responses triggered by wealth taxation can significantly impact broader income tax bases, with some studies indicating that losses in personal income tax revenues can far outweigh the direct losses from wealth tax impositions.
In this environment, developing a sophisticated, holistic view of global tax regimes that balances statutory tax rates with governance quality, tax treaty protections, and political stability proves invaluable. Multipolitan's Tax Friendly Cities Index provides precisely this.
A Multi-metric Approach to Tax Friendliness
At the core of the Tax Friendly Cities Index lies a rigorous, multi-layered methodology that evaluates tax environments at both national and metropolitan levels. The index encompasses major cities within the top 20 tax-friendly countries, which were selected from an initial pool of 164 jurisdictions. High-risk locations, such as those experiencing political instability or ongoing conflict, were excluded to maintain the relevance and applicability of the index for wealth preservation purposes.
The assessment is anchored on three primary metrics. The first metric scrutinises statutory tax rates across five key categories directly affecting HNWIs, namely Personal Income Tax; Corporate Income Tax; Inheritance Tax; Wealth Tax and, of increasing relevance, Capital Gains Tax. By focusing on the highest applicable rates within each category, Multipolitan captures the maximum potential tax exposure an individual might face. The second metric recognises that statutory rates alone do not tell the full story. The presence of Double Taxation Avoidance Treaties (DTATs) significantly enhances a jurisdiction's attractiveness by providing legal mechanisms that prevent double taxation on cross-border income. By tallying the number of DTATs each country has ratified, Multipolitan incorporates a practical measure of international tax protection and planning flexibility.
However, a favourable tax regime without effective governance can present unexpected risks to wealth preservation. Accounting for good governance ensures that the index reflects not just the legal tax burden but also the predictability, fairness, and stability of tax enforcement, which remains a crucial consideration for long-term wealth preservation planning.
Not All Cities Are Equal
By anchoring the analysis at the city level, the index captures the practical realities faced by globally mobile families. Metropolitan centres often serve as the real touchpoints for residency, business operations, and lifestyle decisions. This city-specific focus differentiates Multipolitan's index from many country-only tax comparisons, offering actionable insights for families evaluating relocation or expansion opportunities.
A Timely Tool for a Shifting Landscape
The Tax Friendly Cities Index arrives at a moment when tax policy, regulatory enforcement, and global wealth mobility are converging into a more tightly controlled ecosystem. For wealth preservation, this environment demands a sophisticated understanding of multiple overlapping risks. Residency definitions, treaty benefits, regulatory compliance, and reputational considerations all interlace to shape the actual outcomes of wealth preservation strategies. Optionality in lifestyle, citizenship, education, and asset location has become the cornerstone of modern wealth planning. The Multipolitan index supports this need by offering a comprehensive, comparable view of jurisdictions that balance tax competitiveness with governance integrity.
The Tax Friendly Cities Index serves as both a technical resource and a strategic conversation starter. It empowers stakeholders to make informed, forward-looking decisions amidst an increasingly complex global tax landscape. By integrating quantitative rigor with practical relevance, Multipolitan reaffirms its commitment to delivering actionable insights that help clients preserve and grow their wealth across generations.
Sources
[1] Data was sourced from PricewaterhouseCoopers’ Worldwide Tax Summaries, as well as each individual country’s revenue authority.
[2] ICTD (2021). Tax Treaties Explorer [Online database], Brighton: International Centre for Tax and Development (ICTD), retrieved from https://www.treaties.tax. Please note that determining the exact number of double tax treaties (DTTs) for each country can be challenging due to the dynamic nature of international agreements. The numbers provided in the study are deemed to be a sufficient estimate for a comparative analysis such as this one.
[3] Worldwide Governance Indicators, 2024 Update, World Bank (www.govindicators.org), Accessed on 10/30/2024.


Contributors

.png)


.png)
.png)

Articles